Introduction

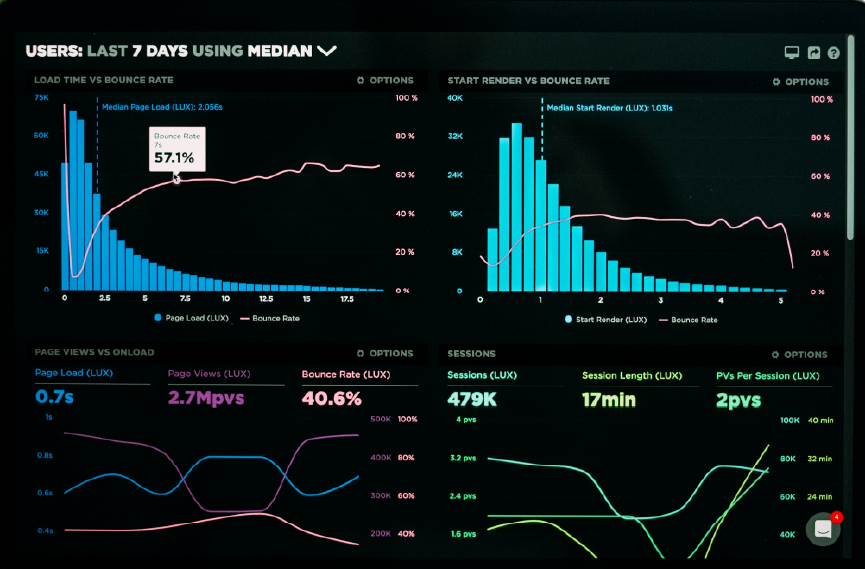
PlayWing, a gaming company in France, faced challenges with managing multiple data sources and their associated reports, which included gameplay and payment analytics.

Many reports from different systems had different but similar columns, and the client manually linked them in many Excel files to generate graphs and filters.

Recognizing the inefficiency of this process, PlayWing sought OPTI to develop a unified dashboard that would streamline their analytics and data visualization, for more informed decisions.

Provocări tehnice

Challenges

The project presented several technical challenges, as follows.

  • Data unification - The client needed a single dashboard to unite all filters, groupings, and variables from various reports and systems.
  • Data extraction - There was a need to extract information (SQL, noSQL, API) from many systems while keeping the underlying reports unchanged.
  • Visual library - A visual dashboard was required to plot graphs and display data in a smart actionable way.
PlayWing
"OPTI is a key partner which allowed us to go to market fast at a moment when our teams were in their infancy. Following attributes describe our collaboration with them: result-oriented, fast, proactive, excellent work ethics."
- PlayWing

Solution

OPTI had a tailored, gradual, approach to overcome these challenges.

  1. Unified display
    • The standardized data from separate sources could be displayed both as tables and graphical data.
  2. Data cataloging
    • All available information was cataloged by data store, date granularity, accessible groupings and facets, and possible combinations of available filters.
  3. Display module
    • The report display reads the data catalog and adjusts available variables (dimensions) based on the chosen filters or groupings so as to connect to data sources.
  4. Data aggregation
    • Data from various data stores are programmatically extracted and aggregated before being sent to the display.
This project required a robust microservices architecture to handle the high transaction volume. Each carrier integration was treated as an independent microservice, allowing for horizontal scaling and easy maintenance. The use of a NoSQL database was crucial for storing the logs of billions of user interactions
Furnizarea vitezei și scalabilității

Results

Search filters

All available data can be filtered by date, country, client, browser, campaign, etc.

Groups and aggregation

Users can view stats per day or group results by any combination of filters.

Date comparison

The dashboard allows comparison of current data with past periods.

Display metrics

The dashboard allows comparison of current data with past periods.

Graph generation

Graphs are generated from all displayed metrics in various chart types.

Trendlines and graphs

The dashboard allows changes to variables and trendlines.

Raw data display

As in Excel, charts and table data reflect each other accurately.

Quick generation

Loading times are kept below one second.

Display on mobile

Both desktop and mobile displays are allowed.

References

Quick Questions

What is the TLDR (conclusion)?

This project required a robust microservices architecture to handle the high transaction volume. Each carrier integration was treated as an independent microservice, allowing for horizontal scaling and easy maintenance. The use of a NoSQL database was crucial for storing the logs of billions of user interactions

What technologies and methodologies are involved?

Technologies: Google Charts, PHP, MySQL, JavaScript, SQL
Methodologies: Business Intelligence (BI), Data unification and aggregation, Data visualization, Time-based filtering and comparison, Data catalog

Nicolae Amarghioalei

Article written by

Nicolae Amarghioalei

Customer Success Manager. Cloud and Onboarding Specialist.

See on LinkedIn →
Interesat?

Want to know more?

See calendar